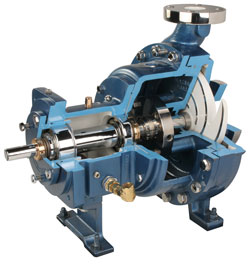
A fluid flow system is identified with a chart named the System Curve. A system curve, here we focus on pump curves, is a graphical presentation of the Energy Equation. In the previous decades, selecting a pump involved sitting down with massive printed catalogs and flipping over them until you reached a pump curve that fit your desired application. Today this process is made much more accessible employing electronic pump curve catalogs. One of the most popular Engineered Software for pump selection is pump-flo, and another one is Intelliquip. To access various types of pumps and select the proper one, visit here.
Pump Curve Chart
Before we talk about the pump curve chart, we have to describe two distinct curves: System Curve and Pump Performance Curve.
System Curve
A System Curve is a graphical presentation of the Energy Equation.
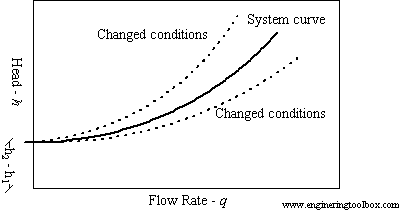
The system head described in the above System Curve is a function of elevation or the static head. The primary and secondary losses in the system then can be expressed as:
h=dh+{ h }_{ l }
in\quad which
h=system\quad head (m)
and
dh= { h }_{ 2 }-{ h }_{ 1 }= static\quad head\quad among\quad inlet\quad and\quad outlet\quad in\quad the\quad system
Also, { h }_{l} represents major and minor losses in the system, which has a generic expression as the following:
{ h }_{l}=k{ q }^{ 2 }
where q is the flow rate, and k is a constant representing characteristics of the system, including major and minor losses.
Pump Performance Curve
The basic pump curve is something similar to the following figure:
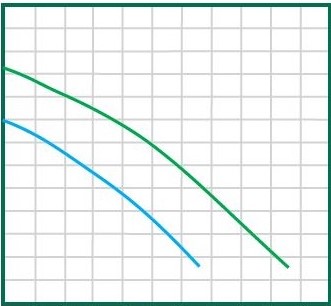
Each kind of pump has a distinct chart, and the data outlined on them also diversifies with the model.
The first impression that should be noticed is that pressure, which represents the head, typically appears on the main vertical Y-axis. On the horizontal X-axis, we ordinarily have the flow rate, describing how much water a pump can transfer.
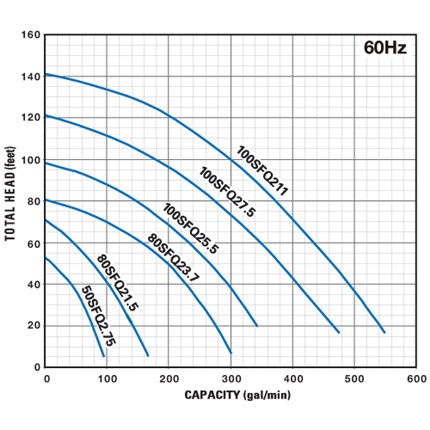
Besides the typical head-flow rate pump curve, there are other curves with essential information for selecting a proper pump, such as efficiency curves, pump curves for several impeller diameters and various speeds, NPSHr curve, and power consumption.
Raising the impeller diameter or speed boosts the head and flow rate capacity, so the pump curve shifts upwards.
The head capacity can be enhanced by joining two or more pumps in series, or the flow rate capacity can be improved by joining two or more pumps in parallel.
Selection of a Proper Pump
The decent pump can be chosen by combining the System Curve and the Pump Curve:
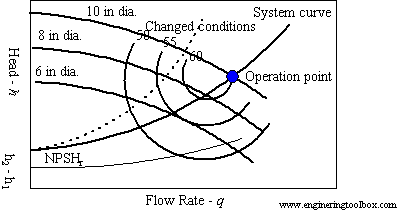
The operating point is wherever the system curve and the actual pump curve meets.
There are some definitions of the points and operating conditions where a pump operates. Here are some definitions:
Best Efficiency Point – BEP
The best-operating states will, in common, be close to the Best Efficiency Point (BEP). Specific attention should be taken for applications where system conditions frequently fluctuate during operation, like applications for air conditioning and heating systems or water supply systems with changeable consumption and modulating valves.
Carry Out
When a pump operates in the far right of its curve with low efficiency, then the pumps Carry Out.
Shutoff Head
The Shutoff Head is the head provided when the pump works with fluid but with no flow rate.
Churn
A pump is in Churn when it runs at shutoff head or no flow.
Reading a Centrifugal Pump Curve
Centrifugal Pump curves present eight critical factors that are crucial in selecting the right pump for a specific operating condition. These factors include Flow, Head, Efficiency, Impeller Trim Diameter, NPSHR, Power, MCSF (Minimum Continuous Stable Flow), and RPM. The Pump curve also represents the Pump model, the Pump size, and the number of stages for multi-stage pumps.
The Pump curve displays the Flowrate range on the horizontal axis. As typical, the Flowrate range varies between zero flow to 20% past the Best Efficiency Flow. The point at zero flow is attributed to as “Shut Off”, and the last point at maximum flow is designated as “Run Out”.
The vertical scale on the primary curve is always a differential head. Differential Head, which is often mentioned as “Head” or “Total Dynamic Head”, is a universal method of quantifying the pressure the pump can develop. Since pressure is relative to the working fluid density, all pump curves essentially present this metric in a length unit (FT or Meters). This causes the pump curve suitable for most liquid types. Exemptions are liquids with high viscosity or solid particles.
Most centrifugal pumps are identified by an elliptical head curve, which is at “Shut Off” and “Run Out” points.
Once the Rated Flow is outlined vertically, and the Rated Head is plotted horizontally, where the two points coincide, Rated Duty Point is ordinarily given as a triangle. Here is a pump Curve demonstrating Flow, Head, HP, NPSHR, Efficiency, Impeller diameter, and the MCSF.
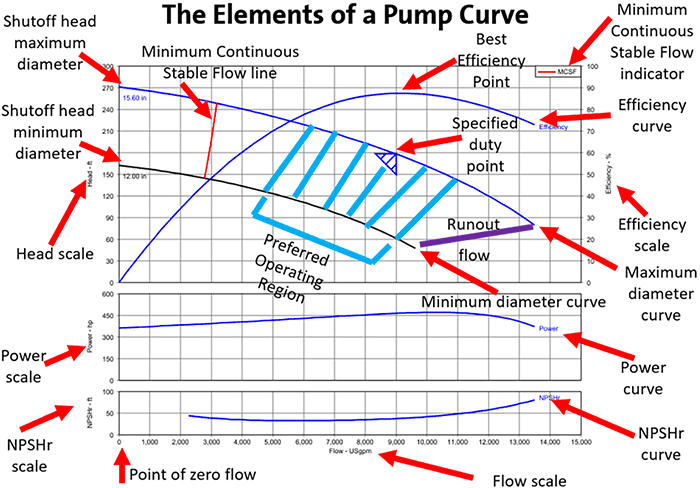
A Centrifugal Pump Curve Elements
To explain, consider the subsequent example and refer to the single-speed curve displayed in the above figure:
- A flow of 9,000 GPM
- A head of 180 feet
Find 9,000 GPM on the horizontal axis, and follow it up until it meets with 180 feet of head on the vertical axis. The intersection point will fall toward the middle of the curve and probably within the preferred operating region (POR), causing the pump the right option for this sample application.
It would be essential to prove that it does, in fact, fall inside the POR by examining the manufacturer’s guidelines.
The same graph can describe how the pump’s performance will vary if the impeller diameter is diminished or expanded. The diameter is shown in inches neighboring its corresponding curve. A shift in impeller diameter does not alter the system curve, which only shifts if a system head changes, such as a closed valve. The intersection points are where the pump operates at each diameter.
Note that it is possible to change the impeller diameter and system conditions, so long as the pump performance still comes within the POR. There is a wider range of the pump curve recognized as the allowed operating region (AOR), in which it may be authorized and profitable to operate the pump. It usually lies between the minimum continuous stable flow (MCSF) line and the runout line. If pump performance falls outside that zone, then another pump should be selected.
Other Pump Curve Elements
A pump curve graph presents other elements necessary for determining the correct product for a specific operating condition.
Efficiency curve
The pump efficiency curve describes a pump’s efficiency over its whole operating range. Efficiency is represented in percentages on the right side of the curve graph. The efficiency curve’s peak characterizes the BEP, with efficiency diminishing as the curve arcs away, either right or left, from the BEP. Understanding the efficiency percentage will also help estimate the horsepower needed for an application.
ISO efficiency lines
International Organization for Standardization (ISO) lines are elliptical curves designating identical efficiency on a pump curve graph. They are used to represent how efficiency levels vary along a pump curve as it goes away from the BEP or if the impeller diameter is decreased.
Power curve
The power curve depicts the load the pump forces on the driver at a provided point on the pump curve and assists with proper motor sizing. It is designated as a separate curve graph and progressively rises toward its peak load, typically close to the BEP with most rotodynamic pump models. Thereafter, it diminishes as it approaches the runout point.
Net positive suction head curve
The net positive suction head required (NPSHr) shows how much force is required to force liquid into the pump impeller’s eye. It is presented in feet below the main pump curve graph. Understanding the correct amount of NPSHr will restrict the pump from cavitating, vibrating, and failing prematurely.
Pump Curve Equation
Engineers commonly use the Hazen-Williams equation for major losses to design and analyze piping systems carrying water at normal temperatures of city water supplies (40 to 75 oF; 4 to 25 oC). A pump curve is included in the calculation to simulate flows comprising centrifugal pumps or other pumps with a pump curve. Two points are typically required on the pump curve, including flow at zero head and head at zero flow and also information particularly about the pipe on the suction side of the pump to compute the net positive suction head available (NPSHA). For a pump to function correctly, the NPSHA must be larger than the NPSH needed by the pump (obtained from the pump manufacturer).
Equations and Methodology
The calculation on this page utilizes the steady-state energy equation. Major losses (as a result of pipe friction) and minor losses (due to valves, pipe bends, etc.) are included in this calculation. The Hazen-Williams equation for friction losses is employed. The equations are conventional equations that can be discovered in most fluid mechanics textbooks. A pump curve is involved in the calculation. The procedure of pump determination in a typical pump selection software is as the following:
- The user must enter the two extreme points on the curve: head when capacity is zero and capacity when the head is zero.
- Then, a parabola with a negative curvature is fit within the two points. This parabola is applied since it is a proper approximation of a standard pump curve and does not want users to enter a multitude of data points. Note that, often, pump catalogs only give the two extreme points on the curve rather than a graph showing the complete curve.
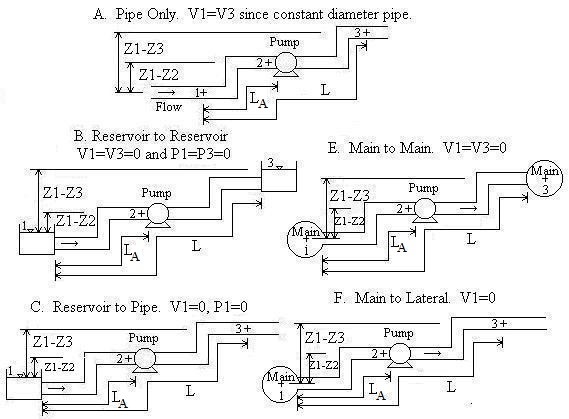
At what follows, some basic equations regarding pump selection is provided:
H+{ Z }_{ 1 }-{ Z }_{ 3 }+\frac { { P }_{ 1 }-{ P }_{ 3 } }{ S } +\frac { { { V }_{ 1 } }^{ 2 }-{ { V }_{ 3 } }^{ 2 } }{ 2g } ={ h }_{ f }+{ h }_{ m }
Where
{ h }_{ f }=L{ \left[ \frac { V }{ kC } { (\frac { 4 }{ D } ) }^{ 0.63 } \right] }^{ 1/0.54 }\quad \quad \quad \quad \quad { h }_{ m }=k\frac { { V }^{ 2 } }{ 2g } ,\quad Q=VA,\quad A=\frac { \pi }{ 4 } { D }^{ 2 }
H={ H }_{ max }\left[ 1-{ \left( \frac { Q }{ { Q }_{ max } } \right) }^{ 2 } \right] ,\quad Equation\quad used\quad for\quad pump\quad curve
NPSH={ Z }_{ 1 }-{ Z }_{ 2 }+\frac { P_{ 1 }+P_{ atm }-P_{ v } }{ S } +\frac { { { V }_{ 1 } }^{ 2 } }{ 2g } -{ h }_{ fA }-{ h }_{ mA }
{ h }_{ fA }={ L }_{ A }{ \left[ \frac { V }{ kC } { \left( \frac { 4 }{ D } \right) }^{ 0.63 } \right] }^{ 1/0.54 },\quad \quad \quad \quad { h }_{ mA }={ k }_{ A }\frac { { V }^{ 2 } }{ 2g }
The variables utilized in the above equations are as the following:
A = Pipe area.
C = Hazen-Williams coefficient.
D = Pipe inside diameter.
DH = Driving Head.
g = Gravitational acceleration.
hf = Major losses for the entire pipe.
hfA = Major losses for pipe upstream of the pump.
hm = Minor losses for the entire pipe.
hmA = Minor losses for pipe upstream of the pump.
H = Total dynamic head.
Hmax = Maximum head that the pump can provide.
k = Unit conversion factor = 0.85 for Metric units.
K = Sum of minor loss coefficients for the entire pipe.
KA = Sum of minor loss coefficients for pipe upstream of the pump.
L = Total pipe length.
LA = Length of pipe upstream of the pump.
NPSHA = Net positive suction head available.
Patm = Atmospheric (or barometric) pressure [P].
Pv = Vapor pressure of the fluid.
P1 = Gage pressure at the surface of a reservoir open to the atmosphere, or the pressure in a supply main like a tank under pressure.
P1-P3 = Pressure difference between points 1 and 3.
Q = Flowrate.
Qmax = Maximum flow rate on the pump curve.
S = Specific Weight of Water.
V1 = Velocity of fluid at location 1. V1 is automatically computed as Q/A.
V3 = Velocity of fluid at location 3. V3 is automatically calculated as Q/A.
Z1-Z2 = Deiffernece among elevation of location 1 and elevation of the pump.
Z1-Z3 = Differnece between elevation of location 1 and elevation of location 3.
Buy Equipment or Ask for a Service
By using Linquip RFQ Service, you can expect to receive quotations from various suppliers across multiple industries and regions.
Click Here to Request a Quotation From Suppliers and Service Providers
Read More on Linquip

